
RadarLab HD Usage Guide
Introduction
RadarLab HD is a weatherTAP feature which allows the user to have interactive control over weather graphic presentation. Using RadarLab HD, the user may select from any number of radar product images such as reflectivity, velocity and echo tops. The "Base Reflectivity (Level-II)" image is built using the higher resolution Level-II radar data. The underlying map on which the radar data and other layers are drawn can be changed to either a land/sea, terrain or satellite based image. Users can then overlay many different geographical layers on the image including county and state boundaries, city and county labels, airports, roads and even user defined custom locations. Users also have the option of displaying many types of data layers. These include current temperatures, lightning strikes, storm tracks, surface observations, watches, warnings and advisories. Users can zoom in up to a 30 meter resolution and pan around the zoomed image by using the mouse. Animations can be created by loading up to 20 radar images. The user can single-step through animations or control the playback speed. All the overlaid layers and zooms also apply to animations. An advanced radar filtering option is available by pressing the "Filter Radar" button. All the currently displayed layers may be automatically reloaded by selecting the "Auto Refresh" checkbox.System Requirements
To use RadarLab HD you need to have Java 1.6.0 or higher installed on your computer. You can download the latest version of java by clicking here. You also need to have your computer screen resolution set to 1024 x 768 or higher. A computer with a CPU speed of at least 1.0 GHz and memory of at least 1.0 GHz is suggested. You should also have a high speed internet connection. While this is not a must, a dial-up internet connection will take a while to download all the needed weather information.Table of Contents
|
Overlay Layers
Radar Layers
Data Layers
|
Animation
Zoom
Mouse Mode
Check Boxes
|
Filter Radar Button
Storm Table Button
|
Settings Button
Change Site Button
GPS Info Button
|
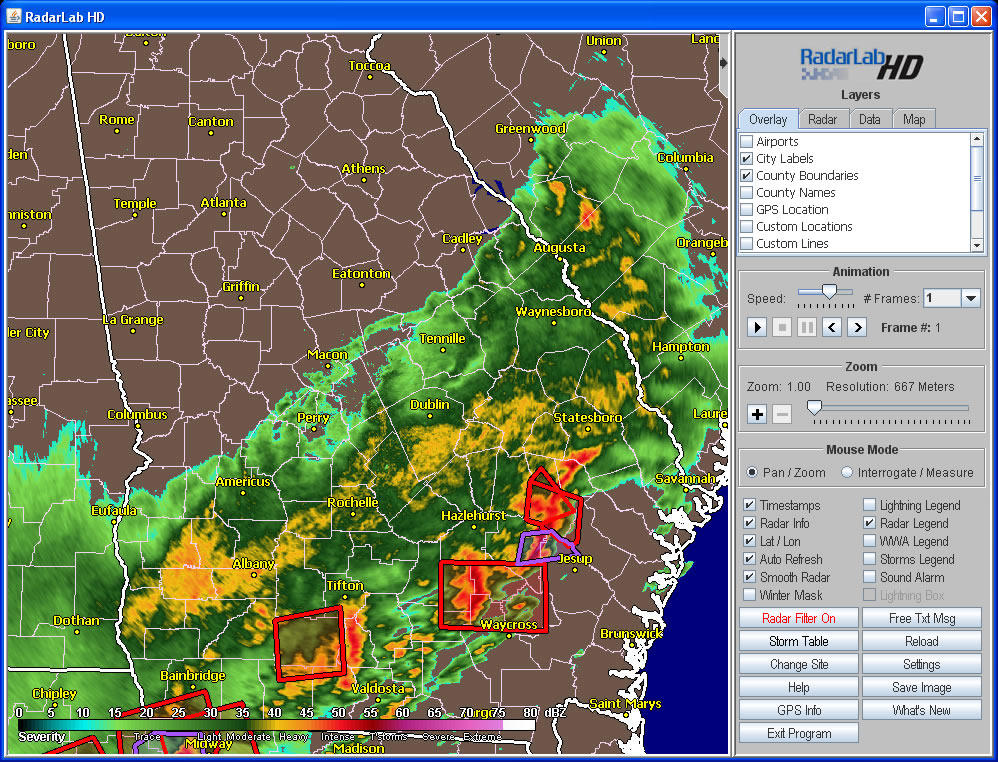
RadarLab HD Screen
The RadarLab HD screen consists of an image panel and a control panel.
Using RadarLab HD
When RadarLab HD is initially loaded, the Level-II base reflectivity image is loaded along with all the layers the user has defined to be loaded. Once RadarLab HD has completely loaded, you may manipulate the image by turning on or off layers or using the different controls located in control panel.
Hiding the Control Panel
You can hide the control panel by clicking on the arrow listed at the top left of the control panel. This can also be accomplished by pressing the F12 key on your keyboard.
Layers
The layers section consists of four different tabs. These are the Overlay, Radar, Data and Map tabs. Each tab contains check boxes and once each checkbox is selected, the layer will then be applied to the image.Overlay Layers
This tab contains checkboxes that are used to load and display different types of geographical data. When the checkbox is selected, the needed data will be retrieved and an image will be built and then displayed. When the checkbox is de-selected the image will no longer be displayed but the data will remain loaded.Airports
This checkbox displays the airports within the given display area. Each Airport is displayed with a circle denoting the location along with the airport name displayed above the circle. As you zoom in, more airports will be displayed.City Labels
This checkbox displays the cities within the given display area. Each city is displayed with a circle denoting the location along with the city name displayed above the circle. As you zoom in more cities will be displayed.County Boundaries
This checkbox displays the county boundaries of the states within the given display area.County Names
This checkbox displays the county names within the given display area. As you zoom in, more county names will be displayed.GPS Location
This checkbox displays your current location on the map as retrieved from your connected GPS device.Custom Locations
This checkbox displays the custom locations that have been entered in the RadarLab HD custom location window. Each custom location that can be plotted within the latitude/longitude area will be displayed. The custom locations will be redrawn at each zoom level.Interstates
This checkbox displays the interstates within the given display area. The interstates are denoted with an interstate symbol along with the interstate number.US & State Roads
This checkbox displays the US and State Routes within the given display area. The routes are denoted with a symbol and the number. Below is an example of the different road symbols used and there meaning.
State Boundaries
This checkbox displays an image of the state boundaries.Radar Layers
This tab contains checkboxes that are used to display different radar products. When the checkbox is selected, the needed radar data will be retrieved and displayed. When the checkbox is de-selected the data layer will no longer be displayed but will remain loaded. To make the checkbox load new data, you can either press the "Reload" button or select the "Auto Refresh" checkbox. If you select the "Auto Refresh" checkbox, all the layers that are selected will be reloaded on a periodic basis, currently every five minutes.Base Reflectivity (Level II)
This checkbox displays a Level II base reflectivity radar image. This is a display of echo intensity measured in dBZ. This product is used to detect precipitation, evaluate storm structure, locate boundaries and determine hail potential.Other Base Reflectivity
This checkbox displays a Level III base reflectivity radar image from the given tilt of either 1 or 2.Composite Reflectivity
This checkbox displays a Level III composite reflectivity radar image. This is a display of maximum reflectivity for three different height ranges within the volume scan. This product is used to reveal the highest reflectivity in all echoes, examine storm structure features and determine intensity of storms.Radial Velocities
This checkbox displays a Level III radial velocity image from the given tilt of 1 or 2. This is a measure of the radial component of the wind either toward the radar (negative values) or away from the radar (positive values). Negative values are represented by cool colors (green) while positive values are represented by warm colors (red). This product is used to estimate wind speed and direction, locate boundaries, locate severe weather signatures and identify suspected areas of turbulence.Storm Relative Velocities
This checkbox displays a Level III storm relative velocity image from the given tilt of 1, 2, 3 or 4. When the motion of storms is subtracted from the wind field, the result is a picture of the wind as if the storms were stationary. Color induces are the same as base velocity. Comparing the storm relative motion image with base velocity image helps identify the rotating storm.1 Hour Precipitation Totals
This checkbox displays a Level III 1 hour precipitation total image. This is a display of estimated one hour precipitation accumulation on a 1.1 X 1.1 nautical mile grid. This product is used to assess rainfall intensities for flash flood warnings, urban flood statements and special weather statements.Storm Precipitation Totals
This checkbox displays a Level III storm precipitation total image. This is a map of estimated storm total precipitation accumulation continuously updated since the last one-hour break. This product is used to locate flood potential over urban or rural areas, estimate total basin runoff and provide rainfall data 24 hours a day.Vertically Integrated Liquid
This checkbox displays a Level III vertically integrated liquid image. This is the water content of a 2.2 X 2.2 nautical mile column of air which is color coded and plotted on a 124 nautical mile map. This product is used as an effective hail indicator, to locate most significant storms and to identify areas of heavy rainfall.Echo Tops
This checkbox displays a Level III echo top image. This is an image of the echo top heights color coded in user-defined increments. This product is used for a quick estimation of the most intense convection and higher echo tops, as an aid in identification of storm structure features and for pilot briefing purposes.Data Layers
This tab contains checkboxes that are used to display layers that have been built using weather data. When the checkbox is selected, the needed weather data will be retrieved and a data layer will be built and displayed. When the checkbox is de-selected the data layer will no longer be displayed but will remain loaded. To make the checkbox load new data, you can either press the "Reload" button or select the "Auto Refresh" checkbox. If you select the "Auto Refresh" checkbox, all the layers that are selected will be reloaded on a periodic basis, currently every five minutes.Current Temps
When selected, displays the current temperatures at different reporting stations. Below is an example of the current temperature plot for Crossville, TN.
When the current temperatures are being displayed, you can click on a current temperature image to receive a zone forecast for that area.
Lightning
When selected, displays lightning strikes as small rectangles. The rectangles are drawn with different colors to denote the age of the lightning strike. Below is an example of a lightning legend that shows the age (in minutes) of the lightning strikes.
Storm Tracks
Nexrad radar sites analyze data from each volume scan to identify storm cells. Each identified cell is assigned an alphanumeric identifier and certain attributes of that cell are tabulated. When selected, RadarLab HD graphically plots the storm cells along with a predicted track. The identified center of the storm cell is plotted as a centroid symbol with the cell identifier printed below. If a cell has been tracked for more than one volume scan, a "track" will be plotted showing the direction of cell movement. Dots along the track indicate predicted positions at 15-minute intervals up to 1 hour. Newly identified cells will have a centroid, but not a track since speed and direction has not yet been determined. You can change the size and color of the storm tracks by clicking on the "Storm Table" button. Below is an example of a storm track.
Different types of storm tracks can be displayed with different colors. There are four different types of tracks; "TVS", "MESO", "Hail" and "Other". The "TVS" is a storm cell that has a Tornadic Vortex Signature associated with it. The "MESO" is a storm cell that has a Mesocyclonic Signature associated with it. The "Hail" is a storm cell that has a probably of hail associated with it. All other storm cells fall in the "Other" category. The color for each type of storm cell can be changed by clicking the "Storm Table" or "Settings" button.
Storm track filtering can also be set by clicking the "Storm Table" button. This allows you to set up certain parameters that a storm cell must meet if it is to be displayed.
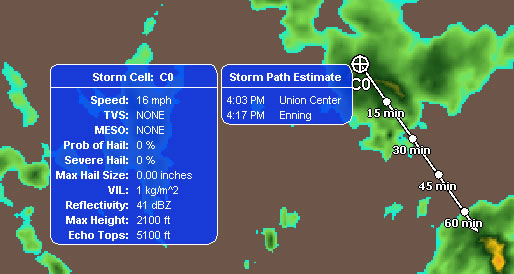
You can place the mouse cursor over the storm cell centroid and the storm cell information will be displayed in a tool-tip format. If the storm cell has been moving, then a Storm Path Estimate will be displayed as well. This shows and estimated time that this storm cell might impact a given city if the storm cell stays at its current speed and on its current path. Below is an example.
Local Storm Reports
This checkbox displays icons that represent Local Storm Reports that have been filed to the National Weather Service. Each weather event is shown with a different icon to represent that event. Events include such things as Tornados, Wind Gusts, Hail, Heavy Rain and more. You can place the mouse cursor over a Local Storm Report icon and the information about the Storm Report will be displayed in a tool-tip format. Below is an example.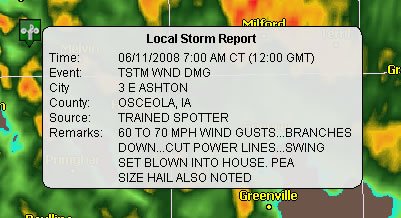
SpotterNetwork
This checkbox displays icons that represent reports filed by storm chasers to the SpotterNetwork. Each weather event is shown with a different icon to represent that event. Events include such things as Tornados, Funnel Clouds, Hail, Heavy Rain and more. You can place the mouse cursor over a SpotterNetwork icon and the information about the report will be displayed in a tool-tip format. Below is an example.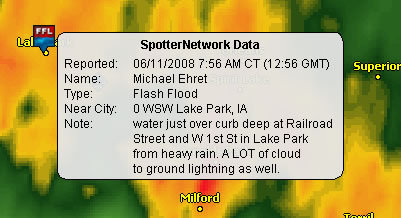
To learn more about the SpotterNetwork, click here.
Surface Obs/Wind Barbs
When selected, displays the latest surface observations from selected stations. The surface observation displays seven pieces of information:1. Wind Barb and Cloud Cover
2. Altimeter (in Hg)
3. Ceiling and coverage of lowest cloud layer
4. Station ID
5. Dew Point (deg Fahrenheit)
6. Visibility (statue miles)
7. Temperature (degrees Fahrenheit)
Below is an example of a surface observation plot.
The above example depicts a surface report from Orlando, Florida (MCO). This observation indicates a temperature of 49 degrees and a dew point of 21 degrees. Sky is broken with winds out of the North at 15kts (wind barb notation). The current barometric pressure is 30.29 inches of mercury and visibility is 10 statute miles. The "120F" designation immediately to the right of the wind barb indicates both the altitude and coverage density of the LOWEST cloud layer. The first three digits indicate the ceiling altitude in hundreds of feet. The 'F' that immediately follows indicates that the clouds are few. Possible values of the coverage density indicator are:
"CLR" = Clear
"F" = Few
"S" = Scattered
"B" = Broken
"O" = Overcast
Although the "120F" indicates a few clouds, the wind barb shows broken coverage. This indicates that a broken layer lies above the few layer at 12,000 ft.
(For FAA purposes 'scattered' or 'few' clouds do not constitute a "ceiling", however, the altitude of any reported cloud layer is portrayed on the map regardless.)
Watches
This checkbox displays a semi-transparent overlay of the current Watches for the given area. Each Watch type is displayed in a different color. When this data layer is selected, you can place your mouse over a Watch to see what type it is as well as the expiration time. You can also press the left mouse button to display the text associated with the Watch.Severe Warnings
This checkbox displays a semi-transparent overlay of the current Severe Warnings for the given area. This includes Tornado, Severe Thunderstorm, Flash Flood and Marine warnings. Each Warning type is displayed in a different color. When this data layer is selected, you can place your mouse over a Warning to see what type it is as well as the expiration time. You can also press the left mouse button to display the text associated with the Warning.Other Warnings
This checkbox displays a semi-transparent overlay of the current Other Warnings for the given area. This includes all the warnings not included in the Severe Warnings overlay. Each Warning type is displayed in a different color. When this data layer is selected, you can place your mouse over a Warning to see what type it is as well as the expiration time. You can also press the left mouse button to display the text associated with the Warning.Advisories
This checkbox displays a semi-transparent overlay of the current Advisories for the given area. When this data layer is selected, you can place your mouse over a Watch to see what type it is as well as the expiration time. You can also press the left mouse button to display the text associated with the Advisory.Map Layers
This tab contains checkboxes that are used to load and display background images. When the checkbox is selected, the needed background image will be retrieved and then displayed. When the checkbox is de-selected the image will no longer be displayed but will remain loaded.Land/Sea
This checkbox displays the land/sea map. This image shows the land as brown in color and the sea as a dark blue. Major lakes are also shown on this map.Terrain
This checkbox displays the terrain map. This is a map of the United States that shows major changes in the terrain.IR Satellite
This checkbox displays the current Infrared Satellite image of the given area.Visible Satellite
This checkbox displays the current Visible Satellite image of the given area.Animation
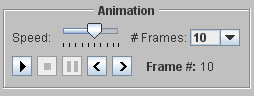
This Animation panel contains all the components needed to animation the radar images. This includes a speed slider, buttons to stop, play, pause and step through the images as well as a combo box to set the number of animation frames.
Speed Slider

This is a slider that affects how fast or slow the images animate. If the slider is moved to the left, this will slow down the animation. If it is moved to the right, this will speed up the animation.
Play Button

When pressed, starts the animation.
Stop Button

When pressed, stops the animation and displays the latest radar image.
Pause Button

When pressed, pauses the animation.
Step Back Button

When pressed, shows the previous image in the animation.
Step Forward Button

When pressed, shows the next image in the animation.
Number of Frames Combo Box

Allows the user to select the number of animation frames to load.
Zoom
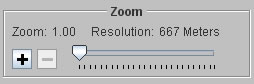
This Zoom panel contains all the components needed to zoom in and out. This includes a zoom-in and zoom-out button as well as a zoom slider.
Zoom In Button

When pressed, this button zooms the map in one level.
Zoom Out Button

When pressed, this button zooms the map out one level.
Zoom Slider

This is a slider that zooms the map in or out depending on which direction it is moved. If the slider is moved to the left, this will zoom out. If it is moved to the right, this will zoom in. You can click on the slider, drag it to any zoom level, and then release the mouse button. This will zoom the map to that zoom level. So if you wish to "un-zoom" the image, just click on and drag the slider all the way to the left.
Zooming with the mouse
Zooming can also be performed with the mouse. Make sure that the "Pan / Zoom" radio button is selected in the "Mouse Mode" panel. Then hold down the right mouse button and drag the mouse. This will create a zoom box. When you release the mouse button, the map will be zoomed into the area that you selected. Below is an example picture of the zoom box.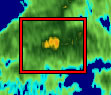
You can also use the scroll wheel on your mouse to zoom. Scroll the wheel forward to zoom in and scroll it backward to zoom out.
Mouse Mode
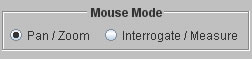
The Mouse Mode panel contains the Radio Buttons needed to perform panning, zooming, interrogating and measuring operations.
Pan / Zoom
This radio button allows the mouse to pan and zoom the map. When this radio button is selected, then the left mouse button is used to pan the map while the right mouse button is used to zoom into the map. To pan the map, just hold down the left mouse button and then drag the mouse. To zoom into the map, hold down the right mouse button and then drag the mouse. This will create a zoom box. Now release the mouse button to zoom into map.Interrogate / Measure
This radio button allows the mouse to perform interrogation and measuring operations. When this radio button is selected, the left mouse button is used to perform an interrogation while the right mouse button is used to perform a measuring calculation.Interrogation
The interrogation operation is used to query National Weather Service stations for the latest observation data. To use this feature, simply left click on the map. The station closest (geographically) to the location that was clicked will be polled and the observation data will be displayed in a separate window. The location of the observation station will be indicated on the map by a yellow square and the station ID. Interrogate mode can be used to gather as many observations as desired. Below is an example interrogation window.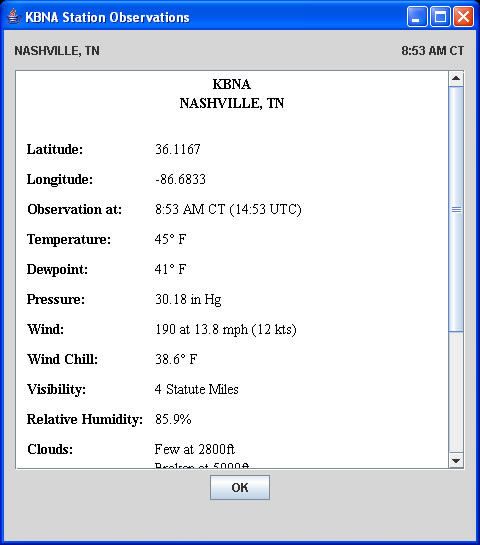
Measuring
The measuring operation is used to calculate the distance and bearing between two points. To use this feature, move the cursor to the first point and hold down the right mouse button. Now drag the cursor around the screen. A label beside the cursor will indicate the distance in miles and nautical miles along with the direction from the first point to the cursor location. Below is an example picture of the measuring tool.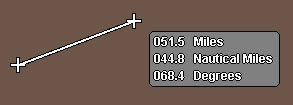
Check Boxes
Timestamps
The "Timestamps" checkbox is used to turn on and off the displaying of product timestamps. When selected, data layers will display their timestamps in the upper left corner of the map. The only exceptions are the radar and storm data timestamps. These timestamps are displayed in the status panel at the bottom of the program. When this checkbox is de-selected, the timestamps will no longer be drawn on the map, however the radar and storm data timestamps will still be displayed in the status panel.Radar Info
The "Radar Info" checkbox is used to turn on and off the displaying of the radar information. When selected, a semi-transparent information box will be displayed in the upper right corner of the map. When this checkbox is de-selected, the radar information box will no longer be drawn on the map. Below is an example of the radar information box.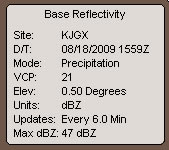
SITE:
This is the station ID for the radar.
D/T:
This valid Date/Time string of the radar image.
MODE:
This denotes what mode the radar is in. This will be either "CLEAR AIR" or "PRECIPITATION".
VCP:
This is the Volume Coverage Pattern. A VCP is a series of 360-degree sweeps of the radar antenna at pre-determined elevation angles completed in a specified period of time.
ELEV:
This is the elevation angle of the radar scan.
UNITS:
This is the units that the radar is measured in (usually dBZ). dBZ is the decibels of Z, Z being the reflectivity factor. The higher the reflectivity factor, the heavier the rainfall.
UPDATES:
This shows how often this radar image is updating.
MAX DBZ:
This is the highest dBZ that exists in the radar image.
Lat / Lon
The "Lat / Lon" checkbox is used to turn on and off the displaying of the latitude, longitude and dBZ value of the current image pixel. When selected, the lat, lon and dBZ value will be displayed on a semi-transparent background in the lower right corner of the map. As the mouse moves around the map, these values will change. When this checkbox is de-selected, the lat, lon and dBZ value will no longer be drawn on the map. Below is an example picture of the lat, lon and dBZ value legend.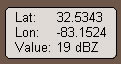
The Latitude and Longitude format is in degrees, decimal degrees. If you have a Latitude / Longitude point that is not in this format you can convert it as follows:
If your Latitude / Longitude is in degrees, minutes, seconds then the conversion is decimal degrees = degrees + (minutes/60) + (seconds/3600).
Example:
Lat = 35� 12' 42.12N = 35 + (12/60) + (42.12/3600) = 35.2117
Lon = 85� 25' 32.25W = -85 + (25/60) + (32.25/3600) = -85.425625
If your Latitude / Longitude is in degrees, minutes then the conversion is decimal degrees = degrees + (minutes/60).
Example:
Lat = 35� 12.45N = 35 + (12.45/60) = 35.2075
Lon = 85� 25.66W = -85 + (25.66/60) = -85.42766
Auto Refresh
The "Auto Refresh" checkbox is used to turn on and off the automatic updating functionality. When selected, the displayed layers will be updated on a periodic basis. When this checkbox is de-selected, the displayed layers will no longer be updated.Smooth Radar
The "Smooth Radar" checkbox is used to turn on and off the smoothing of radar images. When selected, the displayed radar data will have a smoothed appearance. When this checkbox is de-selected, the original radar data is displayed.Winter Mask
The "Winter Mask" checkbox is used to apply a winter mask to the reflectivity radar data to show possible areas of mixed and snow precipitation. When selected, a precipitation mask is downloaded and applied to the radar image. When this checkbox is de-selected, the original radar data is displayed.Lightning Legend
The "Lightning Legend" checkbox is used to turn on and off the displaying of the lightning legend. When selected, the lightning legend will be displayed in the lower left corner of the map. When this checkbox is de-selected, the lightning legend will no longer be drawn on the map. Below is an example picture of the lightning legend.Radar Legend
The "Radar Legend" checkbox is used to turn on and off the displaying of the radar legend. When selected, the radar legend will be displayed in the lower left corner of the map. When this checkbox is de-selected, the radar legend will no longer be drawn on the map. Below is an example picture of the radar legend.
WWA Legend
The "WWA Legend" checkbox is used to turn on and off the displaying of the Watches, Warnings, and Advisories (WWA) legend. When selected, the WWA legend will be displayed in the lower left corner of the map. When this checkbox is de-selected, WWA legend will no longer be drawn on the map. Below is an example picture of the WWA legend.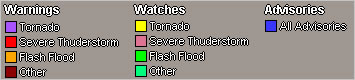
Storms Legend
The "Storms Legend" checkbox is used to turn on and off the storm track legend. There are four different colored tracks. These are the TVS tracks, MESO tracks, Hail track and then the regular storm tracks. When this checkbox is selected, the storms legend will be displayed in the lower left corner of the map. When this checkbox is de-selected, the legend will no longer be drawn on the map. Below is an example picture of the storm track legend.
Sound Alarm
The "Sound Alarm" checkbox is used to turn on and off the weather alarming. When selected, if the alarm settings you have set triggers an alarm, the alarm sound will play. When this checkbox is de-selected, if the alarm settings triggers an alarm, the alarm will NOT sound.Lightning Box
The "Lightning Box" checkbox is for real-time lightning users. It draws a box around your defined real-time lightning coverage area. When selected, a red box is displayed showing your lightning coverage area. When this checkbox is de-selected, the lightning box will no longer be drawn on the map.Buttons
Filter Radar Button
The "Filter Radar" button is used to filter the dBZ and color map of the radar image. When the button is clicked, a new window is opened displaying the components needed to perform the radar image filtering. Below is an example of this window.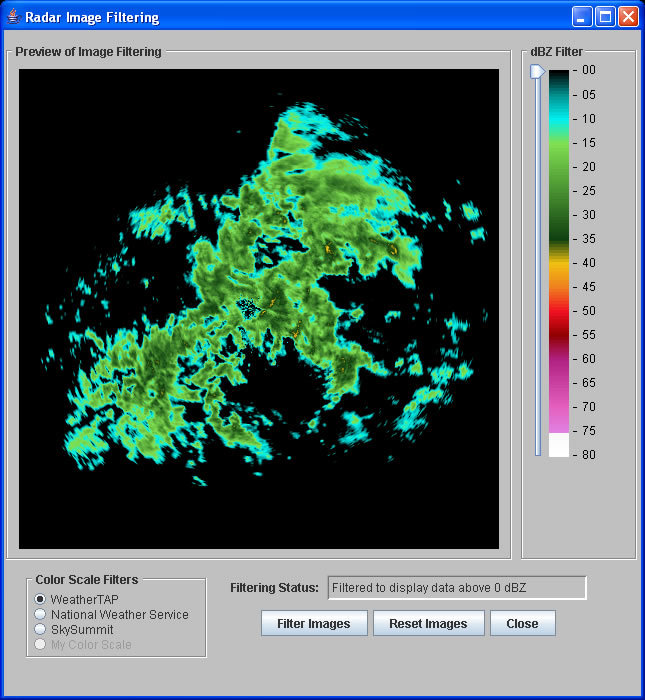
Preview of Image Filtering
This panel shows you a preview of what the radar image will look like with the current filtering.dBZ Filter
This slider is used to filter data based on the dBZ of the radar image. As the slider moves down more data will be filtered from the image. The "Filtering Status:" label informs you of what is the current dBZ filtering. You can click on and drag the "dBZ Filter" slider up and down. When the slider is moved up, the image becomes less filtered and when the slider is moved down, the image becomes more filtered.Color Scale Filters
You can select between the weatherTAP, National Weather Service and what is called SkySummit coloring scales using these radio buttons. Each color scale shows the radar in different colors.Filtering Status
This shows you the current amount of filtering that is occurring for the radar image inside the "Preview of Image Filtering" panel.Filter Image Button
This button applies the current filter settings to all the loaded radar images.Reset Image Button
This button removes all dBZ and color scale filtering from the images.Close Button
This button closes the Radar Image Filtering window.Free Txt Msg Button
The "Free Txt Msg" button is used to display text messages about the radar station. Free text messages are dispatched from NWS WFO's (Weather Forecast Offices) for the sites that NEXRAD maintains. These messages usually contain operational information about the site, such as reasons for downtime and expected return-to-service times. FTM's are usually only issued when there is a problem with the site.Storm Table Button
The "Storm Table" button is used to display a window containing the storm attributes information. When a NEXRAD radar makes a volume scan, the data is examined using a special algorithm that tries to identify storm cells. For each identified cell, a number of characteristics or "attributes" are either measured from the radar data or derived from other algorithms. Attributes for all identified storm cells are tabulated to form the "storm attributes table". This window allows the user view the storm attributes table. Below is a sample storm attribute window.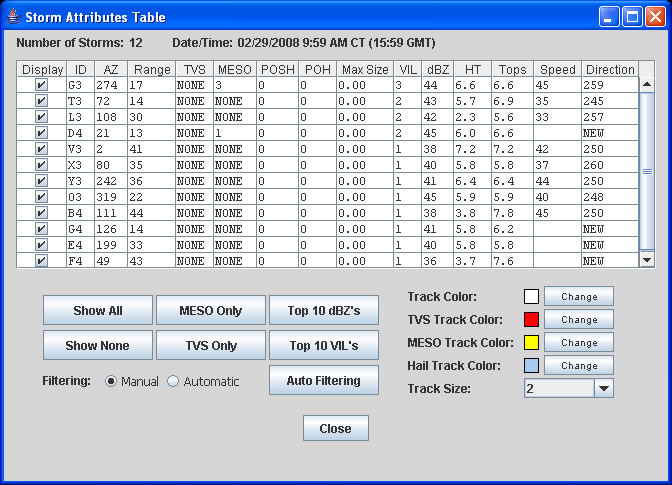
Each attribute will be discussed in detail below:
Display
This value is actually not part of the storm attribute. Instead, it determines whether or not this cell is plotted as part of the "Storm Tracks" layer.ID
When a storm cell is identified by the NEXRAD site, an alphanumeric identifier is assigned. This identifier is arbitrary and contains no specific information about the storm. It's simply an identifier.AZ
This is the azimuth (in degrees) of the position of the cell relative to true North. Taken together, the AZ and Range parameters describe the relative location of the storm cell in Polar coordinates.Range
This is the distance (in miles) between the radar site and the identified cell. Taken together, the AZ and Range parameters describe the relative location of the storm cell in Polar coordinates.TVS
This is the Tornadic Vortex Signature. If the NWS Tornado Detection Algorithm detects sufficient tornado-like rotation in the volume scan, then this value will change to either "TVS" or "ETVS" (Elevated TVS). The current TDA looks at high values of gate-to-gate shear and was developed over many years.MESO
This is the mesocyclone signature. If the NWS Mesocyclone Detection Algorithm (MDA) detected a mesocyclone-like rotation in the volume scan then this value will change to "MESO", "UNCO" (uncorrelated 2-D shear), or "3DCO" (correlated 3-D shear). If the given radar site is using the new NSSL Mesocyclone Detection Algorithm, then this field will be listed as a number ranging from 1 to 25. This is the strength rank of the MDA feature with 1 being the weakest MDA feature and 25 being the strongest. If no MDA detected feature is found within 20 km of the storm cell, it will be listed as "NONE".POSH
This is the percent probability of severe hail.POH
This is the percent probability of hail.Max Size
This is an estimate of the maximum size of hail associated with the identified cell. The estimate is produced from an algorithm and is reported in inches.VIL
This is the VIL (Vertically Integrated Liquid Water) value associated with the cell. VIL is the amount (mass) of water that would be condensed out of a column of air located at the centroid of the cell. The VIL quantity is reported in Kg/m^2.dBZ
This is the maximum amount of reflected radar energy present within the cell from any elevation.HT
This is the height that the maximum dBZ (see above) occurred. This height is reported in thousands of feet, i.e. 1.6 means that the maximum value of reflectivity occurred at 1,600 ft.Tops
This is the echo tops value of the cell determined by radar. Tops are reported in thousands of feet, i.e. 23.4 means that the cell tops are at 23,400 ft.Speed
This is the speed at which the cell is moving (not the maximum speed of the wind contained within the cell). This value is reported in knots.Direction
This is the direction in which the cell is moving from. To get the direction that the cell is moving to, simply subtract 180 from this value. This value is reported in degrees.Show All Button
This button causes all storm tracks to be displayed. This effects all radar images that are loaded.Show None Button
This button causes no storm tracks to be displayed. This effects all radar images that are loaded.MESO Only Button
This button causes only the storm tracks that contain a Mesocyclone Signature to be displayed. This effects all radar images that are loaded.TVS Only Button
This button causes only the storm tracks that contain the Tornadic Vortex Signature to be displayed. This effects all radar images that are loaded.Top 10 dBZ's Button
This button causes only the top 10 storm tracks that have the highest dBZ value to be displayed. This effects all radar images that are loaded.Top 10 VIL's Button
This button causes only the top 10 storm tracks that have the highest Vertically Integrated Liquid Water value to be displayed. This affects all radar images that are loaded.Auto Filter Button
This button allows you to setup the automatic storm track filtering parameters. Once these have been setup, you can click on the "Automatic" filtering option and all storms will be filtered using your automatic settings. You can still manual display and un-display storms by selecting the "Manual" filtering option. Below is a picture of the "Automatic Storm Track Filtering" window.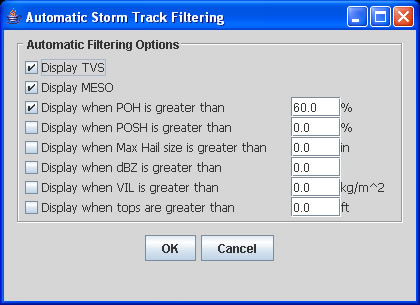
Close Button
This button will close the Storm Attribute Table window.Track Color Change Buttons
This button will change the color of the storm tracks being displayed. There are four types of storm tracks.Hail Track Color: Storm tracks that will have a probability of producing hail.
MESO Track Color: Storm tracks that contain a Mesocyclone Signature.
TVS Track Color: Storm tracks that contain a Tornadic Vortex Signature.
Track Color: All other storm tracks.
Track Size Combo Box
This combo box will change the size of the storm tracks. The larger the number, the larger the storm tracks will be drawn.Reload Button
When this button is pressed, new data for all the layers that are currently selected will be downloaded. The layers will then be updated with the new data.Settings Button
The "Settings" button is used to set the RadarLab HD default settings as well as creating custom locations to plot in the RadarLab HD. When the button is clicked, a new window is opened displaying a three tabbed panel.Default Tab
This tab is used to set the defaults for RadarLab HD when it is launched. All items that are selected in this panel will be loaded each time RadarLab HD is launched. Below is a picture of this tab.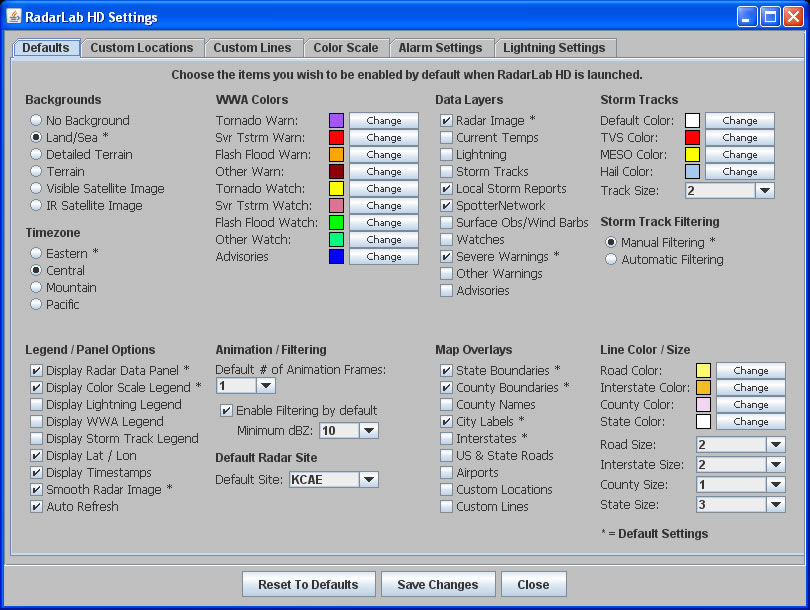
Custom Locations Tab
This tab is used to create custom locations that can be plotted in RadarLab HD. You can enter up to 10 different locations to be plotted. Below is a picture of this tab.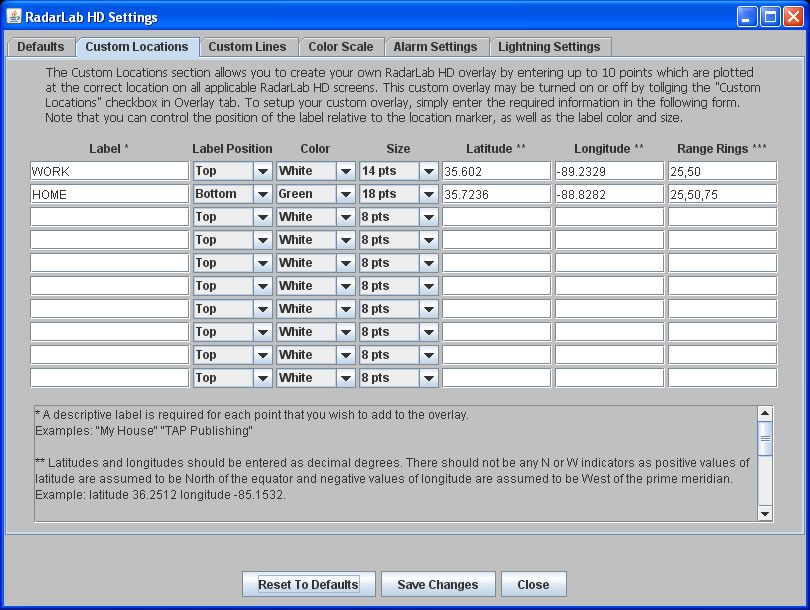
Custom Lines Tab
This tab is used to create custom lines or polygons that can be plotted in RadarLab HD. Each line can be made up of as many latitude/longitude points as you like. All the points that make up your line must be contained on a single line in the Lines text box. Each new line will start on a separate line in the text box. Below is a picture of this tab.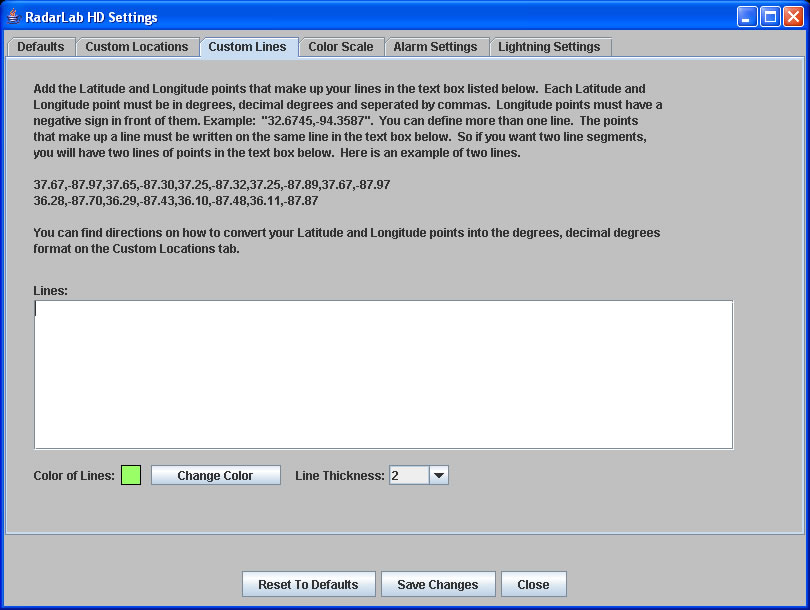
Color Scale Tab
This tab is used to set the color scale to use for the radar images when RadarLab HD is launched. You can select the WeatherTAP or National Weather Service, SkySummit or you own custom color scale.. Below is a picture of this tab.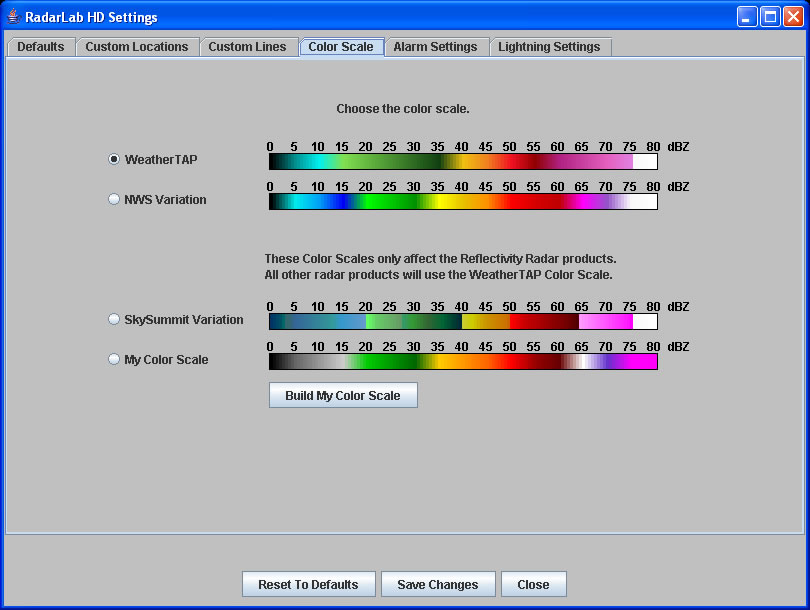
Build Color Scale Button
This button displays the Build My Color Scale window. This window allows you to build you own custom color scale for reflectivity radar data. Below is a picture of this window.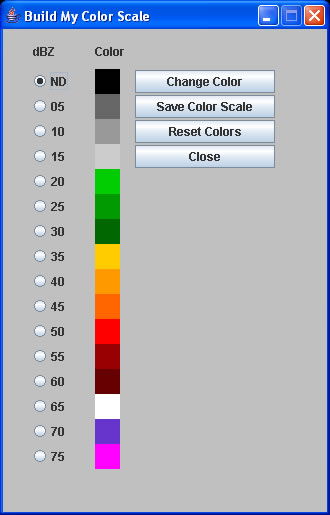
Alarm Settings Tab
This tab is used to set the Alarming feature of RadarLab HD. You can select what weather phenomena will cause the alarm to sound. If any of the selected weather phenomena occurs in you defined latitude / longitude area, then an alarm will sound and a message will be displayed across the top of RadarLab HD explaining the alarm condition. Below is a picture of this tab.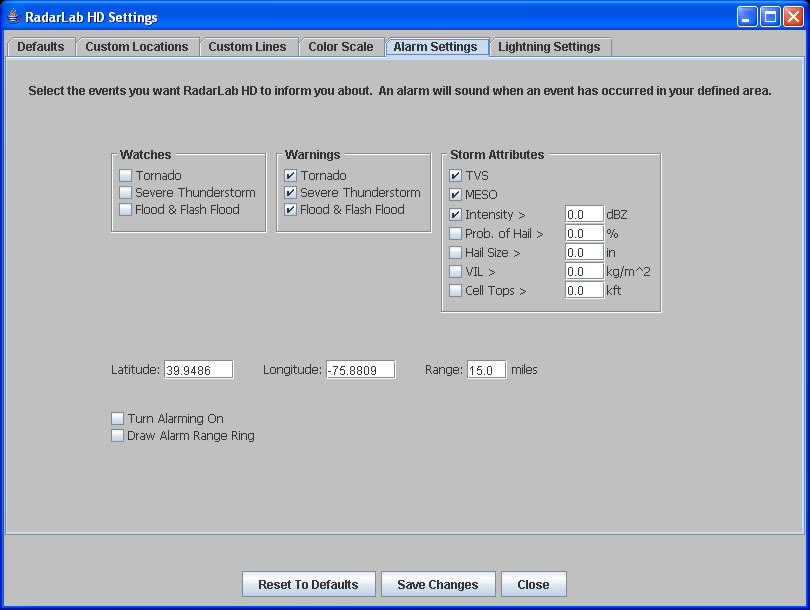
Lightning Settings Tab
This tab is used to set which lightning strikes you want to display. You can show only the newest strikes or only the oldest strikes or any combination you want. Real-time lightning subscribers can also change there area of coverage by typing in a new latitude/longitude center point for their coverage area. Below is a picture of this tab.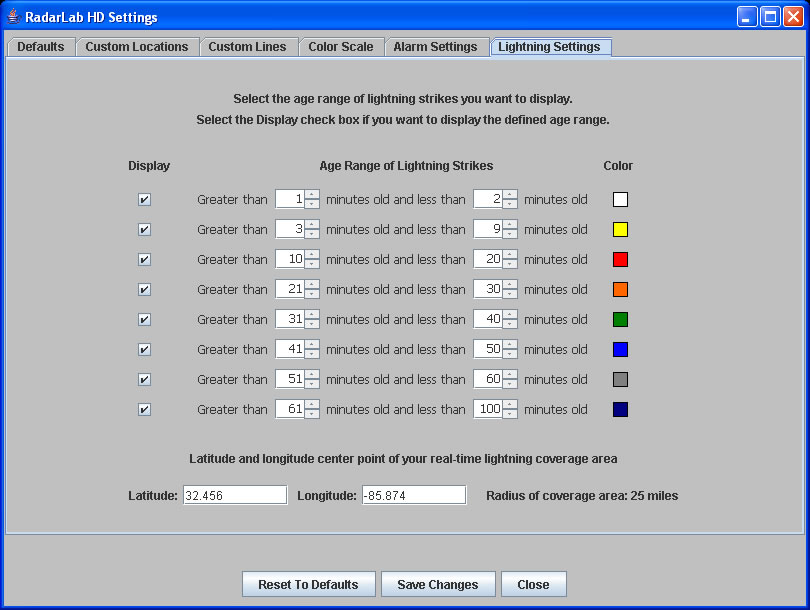
Change Site Button
The "Change Site" button is used to load RadarLab HD with data from a different radar site. When the button is clicked, a new window is displayed showing the current radar data map with Level-II Radar sites drawn as white circles and TDWR radar sites drawn in yellow circles. The radar site that is currently loaded into RadarLab HD will be shown as a black circle with a white outline. To change to a new radar site, click on a white or yellow circle with the left mouse button. The "Selected Radar Site" label will show the name of this new radar site. To view the name of the radar site without selecting it, just place the mouse cursor over a white circle and a tool tip will be displayed showing the radar site. Below is a picture of the Change Radar Sites window.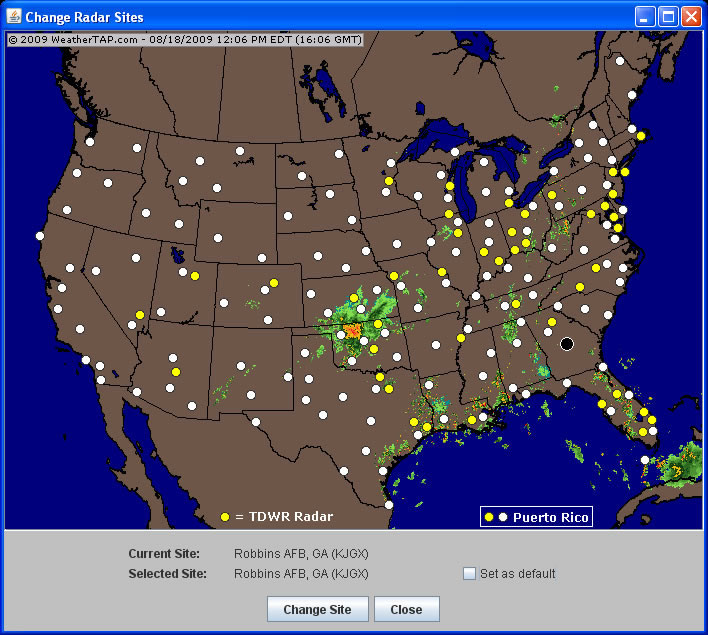
Change Site
This button is used to load data from a newly selected radar site into RadarLab HD.Close
This button is used to close the Change Radar Sites window and return back to RadarLab HD.Save Image Button
The "Save Image" button is used to save the RadarLab HD image that is currently being displayed. These images are written out as PNG images and need to have a ".png" extension when saving. When the button is clicked, an information window will prompt the user that the image must be saved as a PNG image. Once the "OK" button has been clicked on this message, another information box asks the user if the file can be saved to their computer. The user must click "Yes" to save the image. Once this is done, the user will be prompted with a window so they can save the image. Remember to put a ".png" extension on the file name or it will not open in your image viewing software. So the file name could be something like "radarlabhd_image.png".GPS Info Button
The "GPS Info" button is used to setup and use a GPS device that is connected to the computer. RadarLab HD expects the GPS device to output data in the NMEA standard. Most GPS devices support this option. The particular NMEA sentences that RadarLab HD expects are GGA, RMC and GSA. When the GPS Info button is clicked, a GPS Information window will show the current tracking status, current location, speed and direction from the connected GPS device. Below is picture of this window.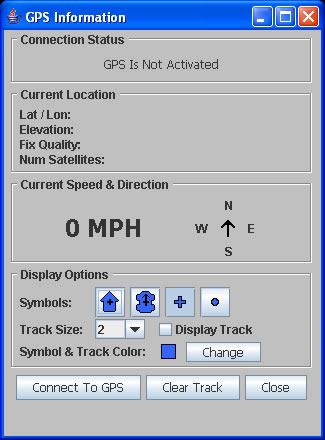
This window allows the user to change which symbol they want to be drawn at their current GPS location. It also allows the user to determine the thickness of the GPS track as well as an option to turn the GPS track on or off. The user can also choose what color they want to their GPS location and track to be drawn in. There are three buttons on the GPS Information window that allow the user to setup the GPS device. They are listed below.
Connect To GPS Button
This button opens a window that allows the user to connect to the GPS device. Below is an image of this window.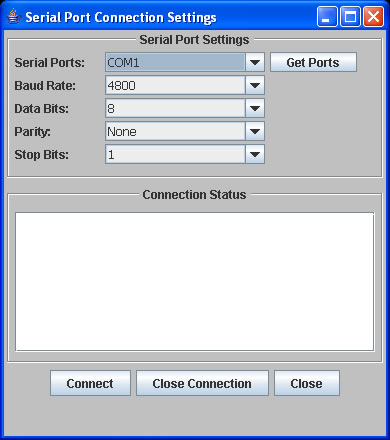
The "Get Ports" button retrieves a list of serial ports that your computer has defined. You must choose the correct serial port that your GPS device is connected to. Check your GPS device to see what the Baud Rate, Data Bits, Parity and Stop Bits should be set to. The default settings on these are the most common, but make sure these are setup based on your GPS device. The "Connect" button tries to connect to the serial port your GPS device is connected to. All status information about the connection will be displayed in the "Connection Status" window. This window will let you know if data is being received or not. The "Close Connection" button closes the connection with the serial port. The "Close" button closes this window.
Clear Track Button
This button clears all the track information that has been stored for the GPS device. It will then start collecting new track points.Close Button
This button closes the GPS Information window.Mac OS X Users
To allow the GPS to work on a Mac you must check the following:1. You must have the folder "uucp" in the directory "/var/spool". To check this, bring up the Terminal and type in the following command:
ls /var/spool
Now see if the "uucp" folder is listed. If not, you must create it by running the following command:
sudo mkdir /var/spool/uucp
You now need to set the proper permissions on this directory. Do this by running the following command:
sudo chmod 777 /var/spool/uucp
2. You should be a member of the "uucp" group. To do this run the commands below depending on what version of OS X you have installed (it would be best to copy and paste these commands):
OS X 10.5 (Leopard) or higher:
sudo dscl . -append /Groups/uucp users `whoami`
OS X 10.4 or lower:
sudo niutil -destroyval / /groups/uucp users `whoami` (The ` in this line is the symbol listed to the left of the number "1" key)
sudo niutil -appendprop / /groups/uucp users `whoami`
3. The Last step is that you should have the folder "lock" in the directory "/var". To check this, in the Terminal type in the following command:
ls /var
Now see if the "lock" folder is listed. If it is not listed, then you must create it by running the following command:
sudo mkdir /var/lock
You now need to set the proper permissions on this folder by running the command:
sudo chmod 777 /var/lock
You should now be able to use the GPS functionality of RadarLab HD on your Mac OS X system.