
Tropical Page Tutorial
WeatherTAP's tropical weather page features a number of products that can help users track a tropical system throughout its life cycle. As a tropical system becomes organized and threatens the US, more products that focus on that particular system will be featured to keep the user informed of the latest developments.
Active Storms
Satellite imagery is the best tool in the meteorological toolbox for monitoring formation and movement of tropical systems. WeatherTAP features visible, thermal infrared (long wave) and water vapor imagery. Areas covered by satellite imagery are listed below.
| Northern Global Hemispheric | Composite of 4 geosynchronous satellites (GOES-10, GOES-12, MeteoSat and GMS) and covers the entire northern hemisphere. Useful in watching storm activity in the Eastern Atlantic. Issued every three hours. |
| Atlantic Basin | Covers the Western Atlantic, Caribbean, and Gulf of Mexico. Issued every thirty minutes. |
| Eastern US | Covers the Gulf of Mexico Region and the Eastern Seaboard. Issued every fifteen minutes except during severe weather events then every five to ten minutes. |
| Gulf of Mexico | covers the entire Gulf of Mexico and Eastern Caribbean Sea. Issued every fifteen minutes except during severe weather events then every five to ten minutes. |
| Caribbean | Covers the Western Caribbean Sea and the islands of Puerto Rico, Dominican republic, and Haiti . Issued every thirty minutes. |
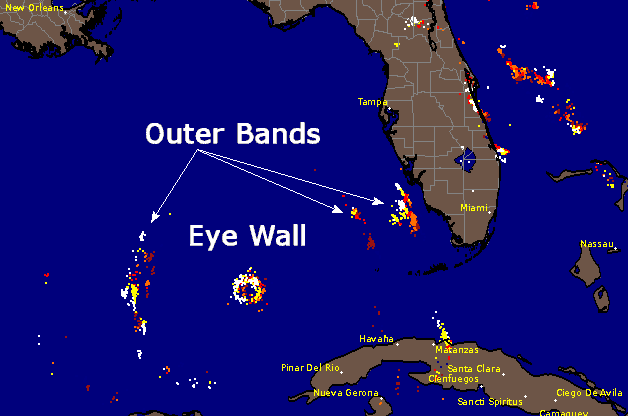
Even though lightning is usually not associated with hurricanes (lightning is not as frequent in a hurricane as it is in continental thunderstorms), lightning data is featured in a national view. Lightning can usually be tracked on the outer bands of a tropical system and sometimes in the eye wall during intensification. The national lightning maps are clickable for closer inspection.
Lightning Graphic Depicting Hurricane Rita
The Tropical Weather Outlook (TWOAT) and Discussion (TWDAT) are located at the bottom of the page. The National Hurricane Center issues these products every six hours and includes a complete synopsis of atmospheric conditions in oceanic regions.
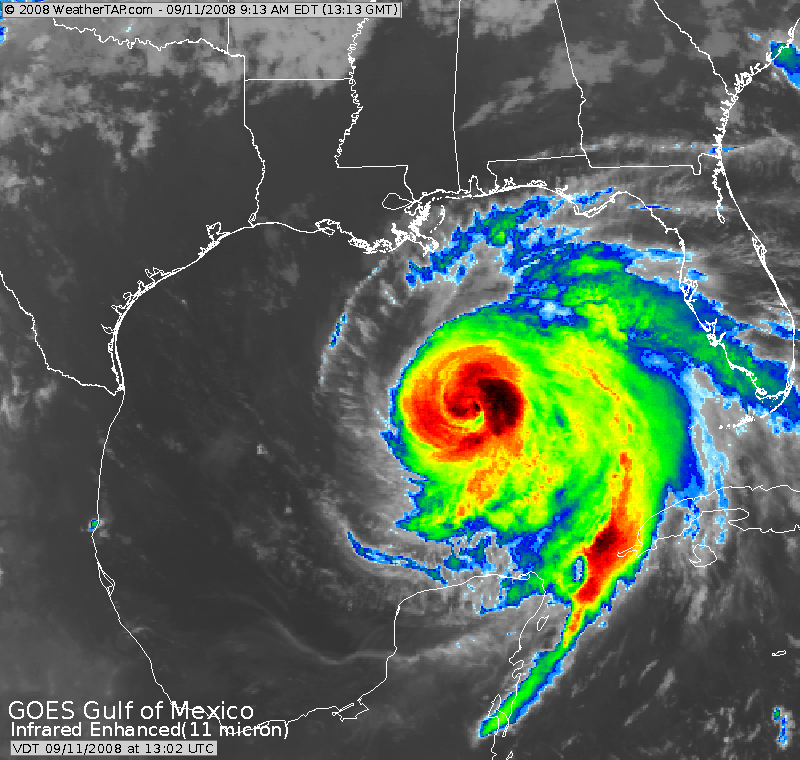
When a storm is named and becomes a potential threat to the US, you can follow that storm using the many Area of Interests (AOI) images that we have created. These areas include the Gulf of Mexico, the Caribbean, the Southwest Atlantic as well as many more. These AOIs are created using visible, thermal long wave infrared, and water vapor imagery.
Enhanced IR4 Gulf of Mexico AOI of Hurricane Ike
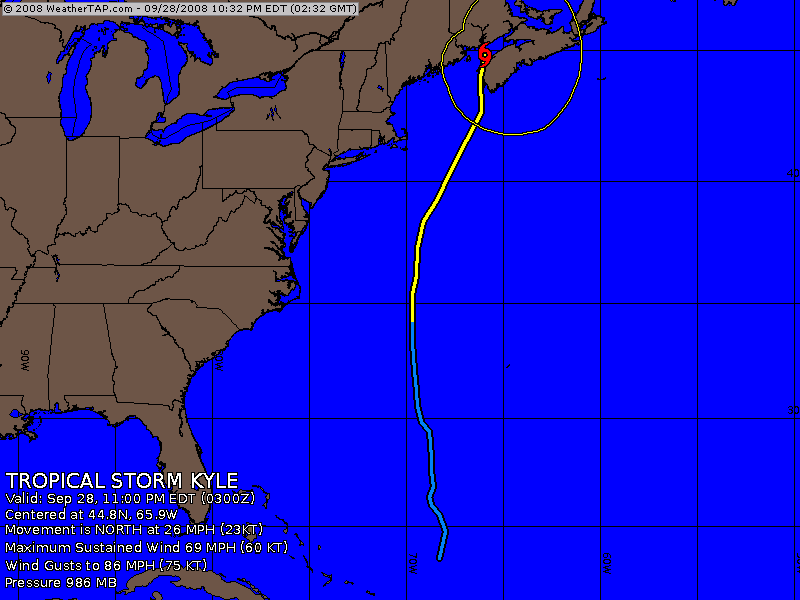
In order to maximize information with a minimum amount of mouse clicks, several enhancements have been introduced to the tracking and forecast charts. These enhancements include
- Map to include full track of the storm once it is named
- Color coded track based on storm intensity
- Storm symbol gets larger as storm intensity increases
- Hurricane category is displayed in center of storm symbol
- Information pertaining to the storm when available such as eye diameter, category and pressure
- Tropical storm and hurricane force wind fields when present
These charts can be viewed on the tropical page when active tropical systems become a threat to the US.
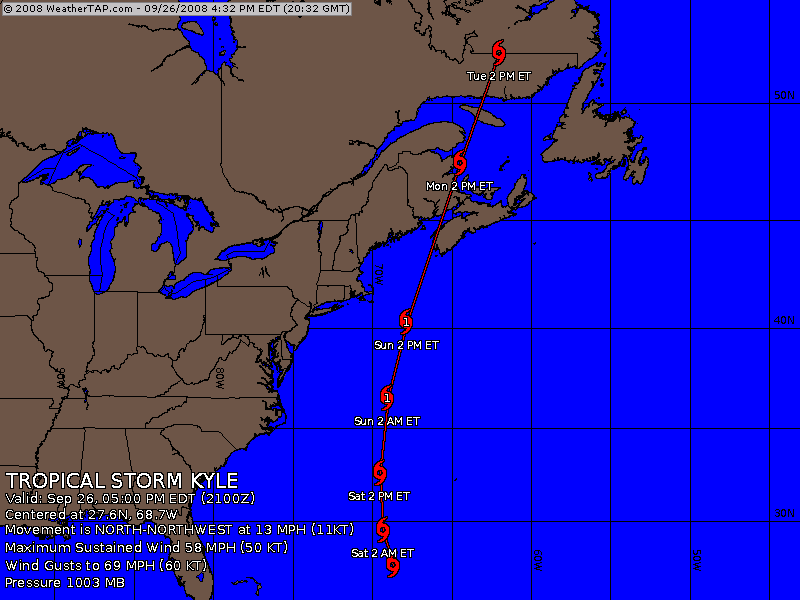
Hurricane tracking chart sample
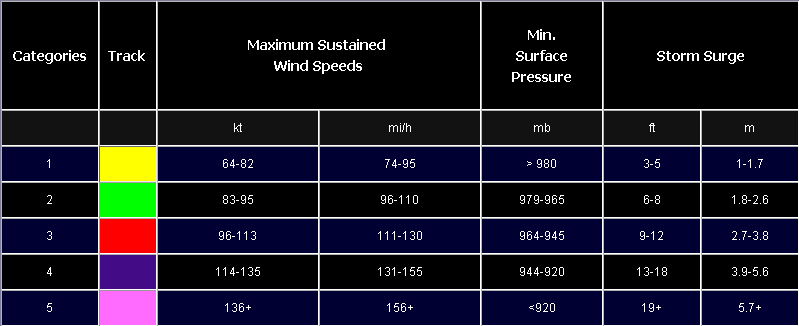
Tracking Color Table and Saffir Simpson Scale
Hurricane forecast chart sample
The radar sites that can pick up echoes from a tropical system are posted on the tropical page. These sites are links that show the base reflectivity tilt 1 animation and the extended base reflectivity animation. As the storm moves and more radar sites are able to "see" the system, these sites will be linked to the page. The level II radar product is also featured to show the storm when in range and can be found directly under the level III radar links.
When a system is named, the National Hurricane Center (NHC) issues products
directly relating to the system. These products are featured on weatherTAP
and include
- Tropical Cyclone Forecast and Advisory
- Tropical Cyclone Public Advisory
- Tropical Cyclone Discussion
- Tropical Cyclone Update
- Local Statements
A link to the watches, warnings and advisories will be posted posted under the text products and will usually encompass the area that is under the threat of the tropical system. The link will lead the user to a map which has the counties highlighted that are under a watch, warning, or advisory. The desired county can be selected and a window will open that will show the text product issued.